Table of Contents
How to Read a Crypto Chart for Beginners
How to Read a Crypto Chart for Beginners…..Hello my dears…Sunday is not just another day! Today, we’re taking a step toward becoming more confident traders by learning an important skill: understanding cryptocurrency charts.
As the year comes to an end, many of us are already thinking about new goals, fresh opportunities, and the skills we want to develop in the year ahead. So, why not add cryptocurrency trading to your learning list?
Whether you’re interested in Bitcoin, Ethereum, or other digital assets, knowing how to read a crypto chart is a great place to start. And remember, you don’t need to rush into trading with real money. You can begin by exploring the charts and practising your analysis in a demo account.
Ready to understand what crypto charts are telling you, recognise price movements, and identify potential trading opportunities?

Let’s dive in and learn how to read a crypto chart for beginners, step by step!
What Is Cryptocurrency?
Cryptocurrency is a type of digital asset that uses cryptography and blockchain or similar distributed ledger technology to record and verify transactions.
Unlike traditional currencies issued by central banks, many cryptocurrencies operate on decentralised networks, allowing users to transfer value without relying on a single central authority.
Some popular examples include:

Cryptocurrencies can be traded against traditional currencies, such as the US dollar, or against other digital assets.
However, cryptocurrency markets are known for their volatility. Prices can rise or fall significantly within short periods, making it important to understand market movements before trading.
2. What Is a Crypto Chart?
A crypto chart is a visual representation of a cryptocurrency’s price movements over a selected period.
It helps traders understand how an asset has performed, identify market trends, and examine the activity of buyers and sellers.
For example, a Bitcoin chart can show whether BTC has generally been rising, falling, or moving sideways over the past few hours, days, or months.
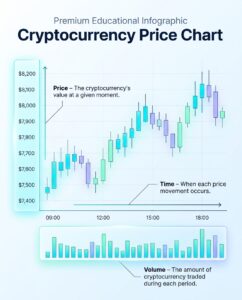
Most crypto charts contain three essential elements:
- Price: Displayed on the vertical axis, showing the cryptocurrency’s value.
- Time: Displayed on the horizontal axis, showing when price movements occurred.
- Volume: Usually displayed beneath the price chart, showing how much of the asset was traded during each period.
What Are the Different Types of Crypto Charts?
Before analysing cryptocurrency prices, you need to understand how market data is displayed.
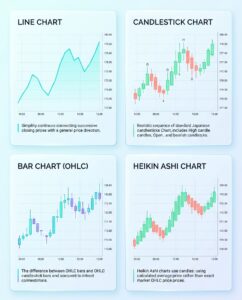
There are several chart types, but beginners should start with these four:
1. Line Chart
A line chart connects closing prices over a selected period to create a continuous line.
It provides a simple overview of price direction without displaying every movement within each trading period.
Best for: Identifying general market trends and comparing price movements.
2. Candlestick Chart
Candlestick charts display four important prices for each period: opening, highest, lowest, and closing prices.
They provide more information than line charts, making it easier to examine price movements and market momentum.
Best for: Analysing price action, identifying patterns, and understanding buying and selling pressure.
3. Bar Chart
A bar chart displays the same four price points as a candlestick chart but uses vertical bars and small horizontal marks.
The left mark represents the opening price, while the right mark represents the closing price. The top and bottom of the bar show the highest and lowest prices.
Best for: Traders who prefer detailed price information in a less colourful format.
4. Heikin Ashi Chart
Heikin Ashi is a modified candlestick chart that uses average price calculations to smooth price movements.
It can make market trends easier to recognise by reducing some short-term fluctuations. However, its displayed prices are calculated values rather than the exact market prices.
Best for: Understanding broader trends and filtering some market noise.
For beginners, standard candlestick charts are the best starting point because they provide clear information about actual opening, closing, highest, and lowest prices.
How to Read Crypto Candlestick Charts
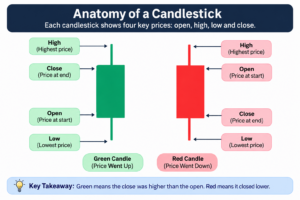
Candlestick charts are among the most widely used tools in technical analysis.
Each candle represents a specific period and shows four prices:
- Open: The price at which the period started.
- High: The highest price reached during that period.
- Low: The lowest price reached during that period.
- Close: The price at which the period ended.
These four values are commonly known as OHLC.
Understanding the Parts of a Candlestick
A candlestick has two main components:
1. The Body
The thick part of the candle represents the difference between its opening and closing prices.
- A large body indicates a relatively strong price movement during that period.
- A small body indicates that the opening and closing prices were relatively close.
2. The Wicks (Shadows)
The thin lines extending above and below the body show the highest and lowest prices reached.
- The upper wick shows how far the price moved above the body.
- The lower wick shows how far the price moved below the body.
Bullish vs. Bearish Candlesticks
Candlestick colours help traders understand whether the price increased or decreased during a specific period.
- Bullish candle (usually green): The closing price is higher than the opening price.
- Bearish candle (usually red): The closing price is lower than the opening price.
A long green candle may indicate strong buying pressure during that period, while a long red candle may indicate strong selling pressure.
However, one candle alone cannot confirm a lasting market trend. Always consider the surrounding candles and the broader price movement.
Five Candlestick Patterns Beginners Should Know
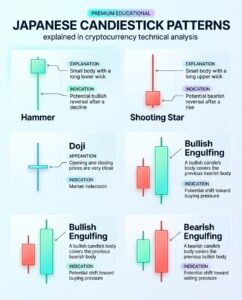
Some candlestick formations can provide clues about potential changes in market sentiment.
| Pattern | Appearance | What it may indicate |
|---|---|---|
| Hammer | Small body with a long lower wick | Potential bullish reversal after a decline |
| Shooting Star | Small body with a long upper wick | Potential bearish reversal after a rise |
| Doji | Opening and closing prices are very close | Market indecision |
| Bullish Engulfing | A bullish candle’s body covers the previous bearish body | Potential shift toward buying pressure |
| Bearish Engulfing | A bearish candle’s body covers the previous bullish body | Potential shift toward selling pressure |
Understanding Crypto Market Trends
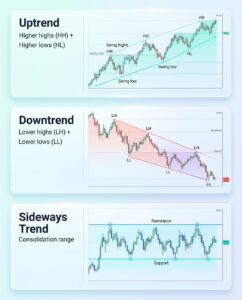
One of the first things you should identify when opening a crypto chart is the overall market trend.
A trend describes the general direction in which an asset’s price is moving.
There are three basic types:
Uptrend
An uptrend occurs when the price generally forms higher highs and higher lows.
This means buyers are pushing prices to new highs, while pullbacks are finding support at progressively higher levels.
Downtrend
A downtrend occurs when the price generally forms lower highs and lower lows.
It indicates that sellers are dominating the market, with each recovery failing to reach the previous high.
Sideways Trend
A sideways trend occurs when the price moves within a relatively defined range without establishing a clear upward or downward direction.
During this phase, buyers and sellers may be relatively balanced.
Beginner tip: Always identify the broader trend before analysing individual candles. A short-term price increase does not necessarily mean the entire market has entered an uptrend.
What Are Support and Resistance in Crypto Trading?
Support and resistance are important price areas where the market has previously experienced buying or selling pressure.
They help traders identify potential turning points and understand where prices may struggle to move further.
What Is Support?
Support is a price area where buying interest has previously emerged, slowing or stopping a decline.
Think of it as a potential floor that the price may struggle to move below.
What Is Resistance?
Resistance is a price area where selling pressure has previously increased, slowing or stopping an upward movement.
Think of it as a potential ceiling that the price may struggle to break above.
How Do Traders Use Support and Resistance?
Traders generally watch these areas for three possible situations:
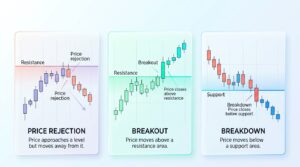
A broken resistance level may later act as support, while broken support may become resistance. This is sometimes called a role reversal.
Remember that support and resistance are better treated as zones rather than perfectly precise price points. They can also fail during periods of strong market volatility.
Five Common Crypto Chart Patterns Every Beginner Should Know
Chart patterns are formations created by price movements. They help traders recognise possible changes in market direction or identify periods when an existing trend may continue.
There are two main categories:
- Reversal patterns: Suggest that the current trend may change direction.
- Continuation patterns: Suggest that the existing trend may resume after a temporary pause.
Here are five common patterns worth learning.
1. Head and Shoulders
The head-and-shoulders pattern is a bearish reversal formation that may appear after an uptrend.
It consists of three peaks:
- Left shoulder: The first peak.
- Head: A higher middle peak.
- Right shoulder: A third peak that is lower than the head.
- Neckline: A support line connecting the two pullback lows.
How to read it: A confirmed break below the neckline may indicate a potential bearish reversal.
Inverse head and shoulders: This is the opposite formation, with three troughs and a deeper middle trough. A breakout above the neckline may signal a potential bullish reversal.
Double Top and Double Bottom
These patterns form when the price tests an important resistance or support area twice.
- Double Top: Creates an M-shaped formation when the price fails to break above resistance twice. It may signal a bearish reversal.
- Double Bottom: Creates a W-shaped formation when the price fails to break below support twice. It may signal a bullish reversal.
How to read them: Watch for a break below the neckline in a double top or above the neckline in a double bottom.
3. Triangle Patterns
Triangle patterns develop when price movements become narrower, creating converging trendlines.
There are three common types:
- Ascending Triangle: Features relatively flat resistance and rising support. It often suggests increasing buying pressure.
- Descending Triangle: Features relatively flat support and declining resistance. It often suggests increasing selling pressure.
- Symmetrical Triangle: Features lower highs and higher lows, indicating consolidation without a clear directional bias.
How to read them: Watch for a breakout above the upper trendline or a breakdown below the lower trendline. The direction of the move provides the initial signal.
4. Flag and Pennant Patterns
Flags and pennants are continuation patterns that typically appear after a strong price movement.
- Flag: Forms a small rectangular channel that usually slopes against the preceding trend.
- Pennant: Forms a small triangular consolidation after a sharp price movement.
How to read them: The initial strong movement forms the flagpole. The following consolidation represents a temporary pause. A breakout in the direction of the original movement may suggest that the trend is resuming.
5. Wedge Patterns
Wedges form when two converging trendlines create a narrowing price structure.
There are two main types:
- Rising Wedge: Forms as price moves upward within a narrowing structure. It can signal a potential bearish reversal or continuation.
- Falling Wedge: Forms as price moves downward within a narrowing structure. It can signal a potential bullish reversal or continuation.
How to read them: Traders watch for a confirmed break through one of the wedge’s trendlines to identify a possible change in direction.
Important: Chart patterns are not guaranteed trading signals. Their interpretation depends on the broader trend, market conditions, trading volume, and price confirmation.
Technical Indicators That Help You Read Crypto Charts
Technical indicators are mathematical tools that use historical price or volume data to help traders examine market trends, momentum, and volatility.
You don’t need dozens of indicators to start analysing crypto charts. Focus on these four:
1. Moving Averages (SMA and EMA)
Moving averages smooth price data to help traders identify the general direction of the market.
There are two common types:
- Simple Moving Average (SMA): Calculates the average closing price over a selected number of periods.
- Exponential Moving Average (EMA): Gives more weight to recent prices, making it more responsive to recent market movements.
Traders often compare short-term and long-term moving averages to identify potential changes in trend direction.
2. Relative Strength Index (RSI)
The Relative Strength Index (RSI) is a momentum indicator that measures the speed and strength of recent price movements on a scale from 0 to 100.
Commonly used RSI levels include:
- Above 70: Often considered overbought.
- Below 30: Often considered oversold.
These levels can help traders assess market momentum, but they do not automatically signal that a reversal is coming.
3. Moving Average Convergence Divergence (MACD)
MACD is a momentum indicator that compares two exponential moving averages to help identify changes in momentum and potential trend shifts.
Traders commonly look for:
- Bullish crossover: The MACD line moves above the signal line.
- Bearish crossover: The MACD line moves below the signal line.
- Histogram: Displays the difference between the MACD line and signal line.
4. Bollinger Bands
Bollinger Bands are volatility indicators consisting of a moving average and two surrounding bands.
They help traders understand how much the price is fluctuating.
- Wider bands generally indicate higher volatility.
- Narrower bands generally indicate lower volatility.
- A price move outside a band may indicate strong momentum, but it does not guarantee a breakout or reversal.
Beginner tip: Start with one or two indicators. Adding too many tools can make your chart confusing and may produce conflicting signals.
Why Trading Volume Matters When Reading Crypto Charts
Trading volume measures how much of a cryptocurrency has been traded during a specific period.
It is usually displayed as vertical bars beneath the main price chart.
Volume helps traders understand how much market participation accompanies a price movement.
| Volume behaviour | What it may indicate |
|---|---|
| Price rises with increasing volume | Stronger buying participation |
| Price falls with increasing volume | Stronger selling participation |
| Price breaks resistance with low volume | The breakout may lack confirmation |
| Price moves sideways with declining volume | Reduced trading activity |
| Volume increases during a breakout | Greater participation in the move |
For example, if Bitcoin breaks above a resistance area with noticeably higher volume, the move may have stronger confirmation than a similar breakout occurring with very little trading activity.
However, volume does not guarantee that a price movement will continue. It should always be analysed alongside price action and market conditions.
How to Analyse a Crypto Chart Step by Step
Now that you understand the basic chart elements, trends, patterns, and indicators, let’s put everything together.
Here is a simple process beginners can follow when analysing a cryptocurrency chart.
Step 1: Choose the cryptocurrency and trading pair
Decide which asset you want to analyse, such as Bitcoin (BTC) or Ethereum (ETH).
Check the trading pair, such as BTC/USD or BTC/USDT, and make sure you are viewing the correct market and exchange.
Step 2: Choose your timeframe
Select a timeframe that matches your analysis.
For beginners, daily and four-hour charts can make broader price movements easier to observe than very short-term charts.
Step 3: Identify the overall trend
Look at recent price movements and determine whether the market is:
- Moving upward.
- Moving downward.
- Trading sideways.
Step 4: Mark support and resistance
Identify the price areas where the market has previously reacted.
These levels can help you understand where buying or selling pressure may emerge.
Step 5: Examine candlesticks and volume
Look at recent completed candles and check whether volume supports the price movement.
Pay attention to strong candles, long wicks, and potential rejection around important levels.
Step 6: Look for chart patterns and indicators
Check whether the price is forming a recognisable pattern.
You can also use an indicator such as RSI or a moving average to support your analysis.
Step 7: Define your risk before considering a trade
Think about where your analysis would no longer be valid, how much you are willing to risk, and where you would exit if the market moves against you.
A good chart analysis considers both potential opportunities and possible losses.
Common Mistakes Beginners Should Avoid When Reading Crypto Charts
Learning to read charts takes practice. However, avoiding common mistakes can make the learning process easier.
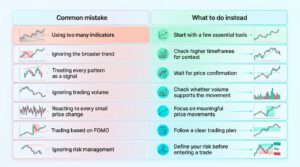
Remember that even experienced traders encounter false signals. The goal is not to predict every market movement but to develop a consistent approach to analysing price behaviour.
Risk Management Tips for Crypto Beginners
Cryptocurrency markets can experience significant price movements within short periods. This makes risk management an essential part of trading.
Keep these practices in mind:
- Use stop-loss orders: Set an exit level to help limit potential losses.
- Manage position sizes: Avoid exposing too much of your trading capital to a single trade.
- Avoid excessive leverage: Leverage increases exposure and can magnify both gains and losses.
- Wait for confirmation: Do not enter a trade simply because a familiar pattern appears.
- Keep a trading journal: Record your analysis, decisions, and results to identify areas for improvement.
- Practise first: Use a demo account to become familiar with charts and test your approach without risking real money.
Never assume that a promising chart setup guarantees a profitable outcome. Always consider the possibility that the market may move against your expectations.
How to Practise Reading Crypto Charts Using a Demo Account
- Open a demo trading account.
- Select a cryptocurrency market, such as Bitcoin or Ethereum, if available.
- Choose a daily or four-hour chart.
- Identify the market trend and mark important support and resistance areas.
- Observe candlestick formations and trading volume.
- Practise analysing possible entry and exit points.
- Record your observations and review your decisions.
Conclusion: Start Reading Crypto Charts with Confidence
Learning how to read a crypto chart for beginners does not have to be complicated.
Start with the basics: understand price, time, and volume. Learn how candlesticks work, recognise market trends, and identify important support and resistance areas.
Once you are comfortable with these concepts, you can explore chart patterns and technical indicators to develop a deeper understanding of market behaviour.
Most importantly, remember that technical analysis is about evaluating possibilities, not predicting the future with certainty. Combine your chart analysis with risk management, patience, and consistent practice.
Your trading knowledge grows one chart at a time. Start learning today, practise in a demo environment, and build your skills before taking the next step.
Linear vs. Logarithmic Crypto Charts
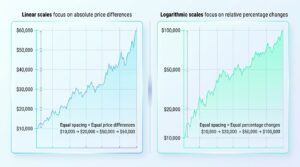
Crypto charts can display price movements using two different scales: linear and logarithmic. Understanding the difference helps you interpret price changes more accurately, especially when analysing long-term trends.
- Linear scale: Gives equal vertical spacing to equal price differences. For example, the distance between $10,000 and $20,000 is the same as between $50,000 and $60,000.
- Logarithmic scale: Gives equal spacing to equal percentage changes. A move from $10,000 to $20,000 takes the same distance as a move from $50,000 to $100,000 because both represent a 100% increase.
Which one should you use?
- Linear charts are useful for examining shorter-term price movements within a relatively narrow range.
- Logarithmic charts are particularly useful for analysing long-term cryptocurrency price history, where prices may have changed significantly over time.
Neither scale is universally better. Choose the one that best suits the period and type of analysis.
Why a Cheap Cryptocurrency Isn’t Necessarily Undervalued
A cryptocurrency trading at $0.10 isn’t automatically a better investment opportunity than one trading at $100 or $60,000.
The price of one token does not tell you how large a cryptocurrency project is. To understand its overall market value, traders also look at market capitalisation, commonly called market cap.
The formula is:
Market Cap = Current Price × Circulating Supply

For example:
Although Coin A has a much lower individual token price, its market capitalisation is five times larger.
What should beginners remember?
- A low token price does not automatically mean an asset is undervalued.
- Circulating supply affects market capitalisation.
- Market cap provides a broader view of an asset’s market size than its individual price.
Always consider supply and market capitalisation alongside the price chart when researching a cryptocurrency.
Understanding Liquidity and Weekend Trading Volume
Cryptocurrency markets operate 24 hours a day, seven days a week. However, trading activity and liquidity can vary throughout the week.
Liquidity refers to how easily an asset can be bought or sold without causing a significant change in its price.
When liquidity is high, there are generally more buyers and sellers available. When liquidity is lower, larger orders may have a greater impact on price movements.
This is particularly relevant during quieter trading periods, including some weekends, when activity in certain markets may decrease.
Before interpreting a sudden price movement, consider:
- Is trading volume increasing or decreasing?
- Is the market experiencing unusually low liquidity?
- Is the price movement supported by broader market participation?
Remember that high volume does not guarantee a successful breakout, and low volume does not automatically mean a price movement will reverse. Volume and liquidity provide context, not certainty.
Frequently Asked Questions about How to Read a Crypto Chart for Beginners
1. How do beginners read crypto charts?
Beginners should start by identifying the cryptocurrency, trading pair, timeframe, and price direction. Then learn to read candlesticks, recognise trends, mark support and resistance, and examine trading volume.
2. Which crypto chart is best for beginners?
Candlestick charts are a useful starting point because they show opening, closing, highest, and lowest prices for each period. Line charts are also helpful for understanding general market direction.
3. What do green and red candles mean in crypto?
A green candle usually means the closing price was higher than the opening price. A red candle usually means the closing price was lower than the opening price.
4. What is the best timeframe for reading crypto charts?
There is no single best timeframe. Daily and four-hour charts can help beginners understand broader market movements, while shorter timeframes provide more detail about intraday price action.
5. What is the difference between bullish and bearish crypto charts?
A bullish chart generally shows upward price movement, often characterised by higher highs and higher lows. A bearish chart generally shows downward movement, often characterised by lower highs and lower lows.
6. Which indicators are best for crypto chart analysis?
Moving averages, RSI, MACD, and Bollinger Bands are commonly used indicators. Each provides different information about trends, momentum, or volatility. Beginners should start with a small number of indicators.
7. Can chart patterns predict cryptocurrency prices?
No. Chart patterns help traders recognise potential market behaviour and evaluate possible price movements. They cannot predict future prices with certainty, and patterns can fail.
8. Is technical analysis enough to trade cryptocurrency?
Technical analysis can help traders understand price movements, but it should not be the only source of information. Market news, project developments, liquidity, and broader economic conditions can also influence cryptocurrency prices.
9. Can I learn to read crypto charts without investing real money?
Yes. You can study historical charts and practise analysing price movements using a demo account. This allows you to develop your understanding of technical analysis without risking real trading capital.