
Table of Contents
How to Read Forex Candlestick Charts for Beginners
How to read forex candlestick charts for beginners……Okay, I know, I know… I keep getting involved in different articles. But a dear friend of mine, who had just started trading and entering our magical world, called me the other day and asked:
“Why do I feel so lost every time I open a trading chart? It looks so weird—it’s full of information, but I don’t really know what I’m looking at. I’m still new and only practicing through a demo account.”

So, you know me, I had to step in and help him… I sent him all of my educational articles, but then I realized something. I needed to go deeper into the chart itself because, duh… that’s the whole point of trading at the end of the day.
That’s when I decided to write this guide on how to read forex candlestick charts for beginners.

So, with no further ado, today we’re going to talk about one of the first things every new trader wants to understand: forex candlesticks—how to read them, what they tell you about the market, and how to use them to make more informed trading decisions.

Let’s dive in!
By the time you finish reading this guide, you’ll know exactly what each candlestick represents, how to identify whether buyers or sellers are in control, and how to spot the first signs of potential trend reversals. More importantly, you’ll learn how to read forex candlestick charts for beginners without feeling overwhelmed by all the colors, lines, and price movements.
And don’t worry. I’m not going to throw dozens of complicated candlestick patterns or technical terms at you. Instead, we’ll break everything down step by step using simple explanations and real examples, so that the next time you open a chart on MetaTrader, TradingView, or any other trading platform, you’ll know exactly what you’re looking at instead of just guessing.
What Are Forex Candlesticks?
If you’ve ever opened a forex chart and thought, “woow what is that and why are there so many red and green candles everywhere?” ….welcome to the club. Every trader has had that exact moment. Despite their name, candlesticks have absolutely nothing to do with candles you light at a dinner date or candles you light when the power goes ohh yeah it doesnt…
What Is a Candlestick?
Before we learn how to read forex candlestick charts for beginners, let’s answer the most basic question.
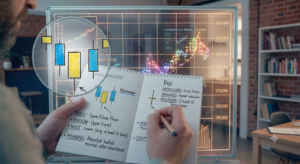
A candlestick is simply a visual way of showing how the price of an asset moved during a specific period of time.
Think of it as a tiny summary of everything that happened during that trading session.
Instead of staring at dozens of numbers, one candlestick tells you four important things:
- Where the price opened.
- How high it went.
- How low it dropped.
- Where it finally closed.
That’s why traders love candlestick charts. They turn raw price data into something you can understand at a quick glance.
Now, since this guide is all about forex, here’s how that applies to currency trading.
Every candlestick on a forex chart represents the price movement of a currency pair, such as EUR/USD, GBP/USD, or USD/JPY, during a specific period of time.
The only thing that changes is the timeframe.
For example:
- On a 1-minute chart, each candlestick represents one minute of trading.
- On a 15-minute chart, each candlestick represents fifteen minutes.
- On a 1-hour chart, each candlestick shows one hour of price movement.
- On a daily chart, each candlestick represents one full trading day.
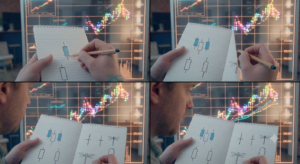
So, if you’re wondering how to read forex candlestick charts for beginners, remember this simple idea:
One candlestick tells the story of one trading period. A forex chart tells the story of many candlesticks working together.
Once you understand that, you’re already halfway to reading a chart with confidence.
How to Read Forex Candlestick Charts for Beginners
Understanding the Anatomy of a Candlestick
Now that you know what a candlestick is, let’s take a closer look at what’s actually inside one. Don’t worry..it looks complicated but it’s very easy to grasp.
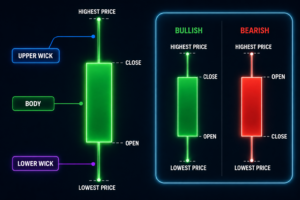
In fact, every candlestick has only three main parts.
- The Body
- The Upper Wick (also called the upper shadow)
- The Lower Wick (also called the lower shadow)
That’s it.
Once you understand these three parts, you’ll already know more than most beginners.
1. The Body
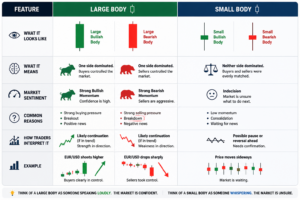
The body is the thick middle part of the candlestick.It’s the most important part because it shows the difference between the opening price and the closing price.Think of it as the main event.If the body is large, it means the market moved strongly during that period.If it’s small, it usually means buyers and sellers were fighting, but neither side managed to gain much control.
2. The Upper Wick
The thin line above the body is called the upper wick.It shows the highest price reached during that trading period.Sometimes buyers push prices much higher……but then sellers step in and push the price back down before the candle closes.When that happens, the upper wick becomes longer.You can think of it as the market saying:
“We tried going higher… but it didn’t last.”
3. The Lower Wick
The lower wick tells the opposite story.It shows the lowest price reached before buyers pushed the market back up.A long lower wick often tells us that sellers lost control and buyers stepped in.Again, don’t worry about memorizing every situation just yet.
For now, simply remember:
- Upper wick = price moved higher.
- Lower wick = price moved lower.
- Body = where the battle finished.
The Four Prices Every Candlestick Shows
Every single candlestick is built using four prices.
These are often called OHLC.
| Price | What It Means |
|---|---|
| Open | The price where the trading period started. |
| High | The highest price reached. |
| Low | The lowest price reached. |
| Close | The price where the trading period ended. |
see it’s easy that’s all there is to it….Seriously….because many beginners think candlestick charts involve complicated math, but they’re really just showing these four prices in a smart and visual way.
Bullish vs. Bearish Candlesticks
Now let’s answer the question everyone asks first…Why are some candles green while others are red? Luckily, this is the easiest part.
A Bullish Candlestick
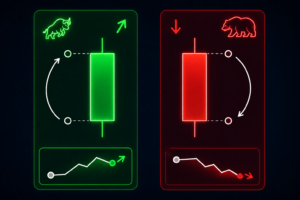
A green candlestick means the price closed higher than where it opened.
In simple words…
Buyers won.
Imagine EUR/USD opens at 1.1200 and closes at 1.1250.
The buyers managed to push the price higher before the trading period ended.
That’s a bullish candle.
A Bearish Candlestick
A red candlestick means the price closed lower than where it opened.
This time…
Sellers won.
For example,
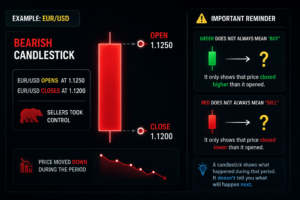
EUR/USD opens at 1.1250
and closes at 1.1200.
The sellers took control, so the candle becomes bearish.
Don’t make the mistake of thinking that green always means “buy” or red always means “sell.”
A candlestick simply tells you what happened during that period.
It doesn’t automatically tell you what will happen next.
That’s something we’ll learn later when we start reading multiple candles together.
Why Do Traders Prefer Candlestick Charts Over Other Types of Charts?
Here’s a fun question. If line charts and bar charts already exist… Why does almost every forex trader use candlestick charts? The answer is actually pretty simple.
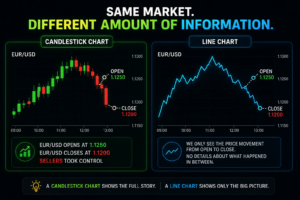
Candlesticks tell a story and visualize teh story in silver platter all for you. A line chart only shows you where the price closed.That’s useful… But imagine watching a football match and only seeing the final score without watching the game.You’d know who won, but you’d miss all the exciting moments in between.That’s exactly how a line chart works.
Candlestick charts show you the entire story of what happened during each trading session.
They reveal:
- Who was stronger—buyers or sellers.
- How much momentum the market had.
- Whether the price was rejected from a certain level.
- If the market was confident or uncertain.
- Whether a trend might continue or reverse.
All of that… from a single candle.
Now imagine what hundreds of candlesticks can tell you when you learn how to read them together.
That’s why professional traders almost always prefer candlestick charts over line charts when analyzing the forex market.
Candlestick Charts vs. Line Charts
| Feature | Candlestick Chart | Line Chart |
|---|---|---|
| Shows Open, High, Low, Close | ✅ | ❌ |
| Easy to Spot Trends | ✅ | Limited |
| Shows Buyer & Seller Psychology | ✅ | ❌ |
| Reveals Candlestick Patterns | ✅ | ❌ |
| Best for Technical Analysis | ✅ | Limited |
How to Read Forex Candlestick Charts for Beginners
(Step-by-Step)
Alright… this is the part you’ve been waiting for…..Everything we’ve talked about so far was just the foundation. Now it’s time to answer the real question that brought you here:
How to read forex candlestick charts for beginners.
And trust me, it’s much easier than most people think…..You don’t need to memorize 50 candlestick patterns….You don’t need to be a math genius…..And you definitely don’t need to predict every market move.
Instead, think of yourself as a detective.
Every candlestick leaves behind clues. Your job is simply to read those clues and understand what buyers and sellers were doing.
Let’s go step by step.
Step 1: Start with the Timeframe
Before you even look at a candlestick, ask yourself one simple question:
“What timeframe am I looking at?”
Remember what we learned earlier? Every candlestick represents one trading period.
Depending on your chart, that period could be:
- 1 Minute
- 5 Minutes
- 15 Minutes
- 1 Hour
- 4 Hours
- 1 Day
- 1 Week
For example…
If you’re looking at a 1-hour chart, each candlestick tells you everything that happened during one hour.
If you’re looking at a daily chart, each candle represents one full trading day.
The candlestick itself doesn’t change.
Only the amount of time it represents does.
Beginner Tip: Don’t jump between five different timeframes every few minutes. Pick one timeframe, learn how it behaves, and build confidence before moving to another.
Step 2: Read the Color First
Now look at the candle itself…..Ask yourself…Who won this battle? ..If the candle is green, buyers won.
They managed to close the price above where it opened. If the candle is red, sellers won.
They pushed the price lower before the candle closed.
That’s literally the first thing professional traders notice.
Not the pattern.
Not the indicator.
Just…
Who is currently stronger?
Imagine a football match.
Green means Team Buyers scored more goals.
Red means Team Sellers scored more goals.
Simple, right?
Step 3: Look at the Size of the Body
Now things start getting interesting…..Not all candlesticks are created equal….Some have tiny bodies….Others have huge bodies…And that tells you a lot.
Step 4: Read the Wicks
Here’s where beginners usually have an “Aha!” moment. The wicks tell you what almost happened.And sometimes…What almost happened is even more important than what actually happened.Let’s look at both situations.
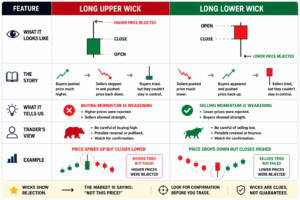
Wicks are like footprints. They show where price traveled during the battle, even if it didn’t stay there. The body shows where the battle ended. The wicks show where the battle went before returning.
Step 5: Never Read Just One Candlestick
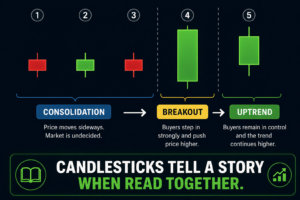
One of the biggest mistakes beginners make is trying to predict the market from a single candlestick. The truth is, one candle means very little on its own. Think of it like reading a book…you wouldn’t understand the entire story by reading just one sentence. Forex charts work the same way. Professional traders don’t ask, “What does this candle mean?” Instead, they ask, “What story are these candles telling together?”
For example, imagine you see three small candles followed by one large bullish candle and then another bullish candle. That sequence suggests buyers are gradually taking control and momentum is building. Now compare that with three strong bearish candles followed by a small Doji and then another bearish candle. The message is completely different—it shows that sellers remain in control despite a brief pause. Successful candlestick analysis isn’t about reading one isolated candle; it’s about understanding the story that a sequence of candles tells.
Step 6: Always Look at the Bigger Picture
Here’s something I wish someone had told me earlier back when I first started trading. A candlestick doesn’t exist in the middle of nowhere.It appears somewhere on the chart. And where it appears matters just as much as what it looks like.
Ask yourself:
- Is the market trending up?
- Is it trending down?
- Is price near a support level?
- Is price near resistance?
- Is this after a strong move?
- Is the market ranging?
The exact same bullish candle can mean two completely different things depending on where it appears.
Context is everything.
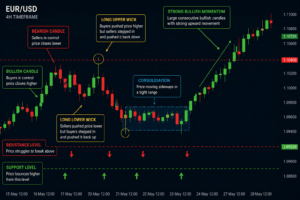
Reading the Story Behind the Candlesticks
Ok.. Time out … Take a deep breathe and let’s put everything together. When you open a chart, don’t immediately search for a Hammer or an Engulfing pattern.
Instead, ask yourself these five questions.
1. Who won this candle?
Buyers or sellers?
2. Was the move strong?
Large body?
Small body?
3. Did the market reject higher or lower prices?
Look at the wicks.
4. What have the last few candles been doing?
Trending?
Moving sideways?
Reversing?
5. Where is price?
Support?
Resistance?
Middle of nowhere?
If you can answer these five questions, you’re already reading charts the way experienced traders do.
And guess what?
You didn’t have to memorize a single candlestick pattern to get there.
Beginner Exercise
Come Closer ..Yes you I’m going to give you a little challenge just for you.
Open a demo account …Don’t place a single trade.
Instead, spend 10 minutes looking at a chart and ask yourself these questions for every candle:
- Is it bullish or bearish?
- Is the body large or small?
- Are the wicks long or short?
- Who seems to be in control?
- What story do the last five candles tell?
Do this every day for one week. You’ll be amazed at how quickly your eyes start recognizing price action naturally.
Think of it like learning a new language. At first, every candlestick looks random.
After a while, you’ll start reading them almost without thinking.
The 6 Candlestick Patterns Every Beginner Should Know
Now that you know how to read forex candlestick charts for beginners, it’s time to meet the candlestick patterns you’ll see over and over again. But before we start… I want you to promise me something…Don’t try to memorize every pattern you see on the internet.
There are dozens, some people even say there are more than 70 candlestick patterns. The good news? You don’t need all of them to become a successful trader.
In fact, many experienced traders rely on just a handful of patterns combined with trend analysis, support and resistance, and good risk management.
So let’s keep it simple.
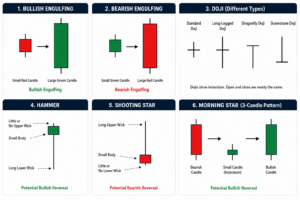
Common Mistakes Beginners Make When Reading Candlestick Charts
Learning candlestick patterns is an important first step, but knowing how to use them correctly is even more important. One of the biggest reasons beginners lose money is treating every pattern as an automatic buy or sell signal. A candlestick pattern is simply a clue—it should always be viewed within the bigger market picture.
Here are some of the most common mistakes beginners make:
- Reading only one candlestick.
A single candle rarely tells the whole story. Always look at the candles before and after it to understand the market’s momentum.
- Ignoring the overall trend.
A bullish pattern is generally more reliable in an uptrend, while a bearish pattern carries more weight in a downtrend. Remember, the trend is your friend.
- Forgetting about support and resistance.
Candlestick patterns become much more meaningful when they form near important price levels rather than in the middle of a random price move.
- Trading without confirmation.
Don’t rush into a trade as soon as a pattern appears. Wait for confirmation from the next candle, a breakout, increasing volume, or another technical signal.
- Trying to memorize every pattern.
You don’t need to know dozens of candlestick patterns. It’s far more valuable to understand a few common patterns and the market psychology behind them.
The Best Timeframes for Beginners
One question beginners ask all the time is: “Which chart should I actually use?” Here’s a simple guide.
| Timeframe | Best For |
|---|---|
| 1 Minute | Scalping (not recommended for beginners) |
| 5 Minutes | Fast trading |
| 15 Minutes | Intraday trading |
| 1 Hour | Great for beginners |
| 4 Hours | Swing trading |
| Daily | Long-term analysis |
If you’re just learning how to read forex candlestick charts for beginners, I’d recommend starting with the 1-hour or 4-hour chart. They move more slowly, making it easier to spot trends and understand what’s happening.
FAQ’s about How to Read Forex Candlestick Charts for Beginners
How long does it take to learn candlestick charts?
Most beginners can understand the basics within a few days. Becoming confident at reading price action takes regular practice and experience.
Which timeframe is best for beginners?
The 1-hour (H1) and 4-hour (H4) timeframes are ideal for beginners because they contain less market noise than lower timeframes.
Can I trade using candlestick patterns alone?
Yes, but it’s not recommended for beginners. Candlestick patterns are more reliable when combined with trend analysis, support and resistance, and other technical tools.
Are candlestick patterns always accurate?
No. No candlestick pattern works 100% of the time. They help identify potential market direction, but they do not guarantee future price movements.
What is the easiest candlestick pattern for beginners?
The Hammer, Doji, Bullish Engulfing, and Bearish Engulfing are among the easiest and most widely used candlestick patterns.
Do candlestick patterns work in all financial markets?
Yes. Candlestick analysis works in Forex, stocks, commodities, indices, and cryptocurrencies because it is based on price action.
Can I read Forex charts without using indicators?
Yes. Many traders rely on price action and candlestick charts alone. However, beginners often benefit from using simple indicators like Moving Averages or RSI for additional confirmation.
What is the difference between a bullish and a bearish candlestick?
A bullish candlestick closes above its opening price, showing buyers were stronger during that period. A bearish candlestick closes below its opening price, showing sellers were in control.
What does a candlestick wick tell you?
The wick shows the highest and lowest prices reached during the trading period. Long wicks often indicate price rejection and can signal weakening momentum.
How many candlesticks should I analyze together?
Never rely on a single candlestick. Looking at several consecutive candles provides a much clearer picture of market sentiment and momentum.
What is the difference between a candlestick chart and a line chart?
A line chart shows only closing prices, while a candlestick chart displays the open, high, low, and close, giving traders much more information about price movement.
What should I check before trading a candlestick pattern?
Always check the overall trend, nearby support and resistance levels, and wait for confirmation before entering a trade.
Which trading platform is best for practicing candlestick analysis?
Beginners commonly use MetaTrader 4 (MT4), MetaTrader 5 (MT5), or TradingView because they offer clear candlestick charts and free demo accounts.
How can I practice reading candlestick charts without risking money?
Open a demo account and practice identifying patterns on live charts. Reviewing your analysis regularly will help you build confidence before trading with real money.
Should I memorize every candlestick pattern?
No. It’s better to understand a few common patterns and the market psychology behind them than to memorize dozens of patterns without knowing how to use them.
Why do candlestick patterns sometimes fail?
Patterns can fail because markets are influenced by many factors, including trends, economic news, volatility, and trader sentiment. That’s why context and risk management are essential.
Can candlestick charts predict the market?
No. Candlestick charts do not predict the future. They simply help traders assess probabilities based on past and current price action.
How should I set up my chart before reading candlesticks?
Use a candlestick chart, choose a clean layout, remove unnecessary indicators, and start with the 1-hour or 4-hour timeframe so you can focus on price action instead of chart clutter.
How long does it take to learn candlestick charts?
Most beginners can understand the basics within a few days. Becoming confident in reading market behavior takes more practice, but consistency is more important than speed.
Which timeframe is best for beginners?
The 1-hour and 4-hour charts are often easier for beginners because they contain less market noise than very short timeframes.
Wrap-up
Woohoo! If you’ve made it this far, congratulations! You now understand much more than just the colors of green and red candles.
You’ve learned how to read Forex candlestick charts, understand the body and wicks of a candle, and recognize some of the most common candlestick patterns you’ll see in the market.
But here’s one final piece of advice before you close this article: don’t rush into live trading just because you’ve learned a few patterns. Open a demo account, watch how the market moves, and practice reading candlesticks every day.
With patience and consistency, those random red and green candles will slowly turn into a story you can actually read. And trust me—once that happens, you’ll never look at a Forex chart the same way again.