Table of Contents
The Fair Value of Silver Explained
A Complete Study
First:
Valuing commodities, especially silver, is one of the most complex investment challenges. Silver is not a company that generates discountable cash flows, nor does it have a business model or management whose decisions can be analyzed. However, simply viewing the market price as a direct reflection of immediate supply and demand or speculative momentum often leads to delayed, cyclical, or clearly biased investment decisions.
Hence the need for a different valuation framework; one that doesn’t attempt to predict the future price, but rather seeks to estimate the potential fair value around which the price will revolve in the medium and long term. This framework combines economic logic that identifies the long-term price center of gravity with technical analysis that assesses current market behavior and determines which scenarios are most likely at the present moment.
Second:
Economic evaluation. The logic of marginal cost and the long-term center of gravity of price.
1. The logic of marginal cost as an economic basis for price.
In the long run, no commodity market can continue to price a commodity below its maximum marginal cost of production. This doesn’t refer to the average cost, nor the cost of the most efficient producers, but rather the cost of the last remaining product capable of remaining in the market . In this case, it’s the highest production price of the last ounce of silver produced. Companies that extract silver from the earth calculate the cost per ounce by dividing total costs by total production. When demand for silver or gold increases, companies operate their production lines at full capacity to capitalize on the often temporary price rise. This means an increase in the cost of producing an ounce. The highest production price per ounce is then used as the basis for the calculation.
The mechanism of adjustment in commodity markets is not solely driven by demand, but—more importantly—by supply. When prices fall for an extended period, low-cost producers continue production, while higher-cost producers begin to reduce output, postpone expansions, or exit the market altogether. This gradual withdrawal reduces supply, pushing prices back toward a level that ensures the survival of marginal producers. Therefore, the highest cost represents an economic floor or long-term center of gravity for price, not merely an accounting figure. Why? Because the highest price is the price at which, when prices fall, higher-cost producers begin to reduce production, thus triggering a decrease in supply. At this price, the price begins to move toward equilibrium with the reduced demand.
2. Determining the economic basis of silver
- commodity price fluctuations
- Geological and regulatory risks
- The long-term capitalist nature of the mining industry
3. Two methods for calculating the fair value of silver.
- Price surge (Trend/Spike) condition
Where liquidity, momentum, and speculation reign supreme, economic logic is ignored for extended periods. In such a scenario, prices can rise to levels far removed from the center of gravity, as has occurred in recent months. - Mean Reversion
As the momentum slows, the market enters a price or time correction, and prices begin to approach the logic of cost and supply. In this context, $110 per ounce can be used as a realistic benchmark for a price surge, representing the highest price for an ounce of gold this year, not as a fair value, but as a representation of what the price could reach at the peak of strong momentum. Conversely, $40 per ounce represents the benchmark for economic equilibrium. This is the price at which supply begins to contract. Economically, it is also the price to which the price of a financial asset should return, reflecting the economic average. Alternatively, the cost of production could rise further, leading to equilibrium.
Third:
- Current market situation
- trend force
- Degree of overbuying or overselling
- Timing quality from a risk-reward perspective
In other words: Technical analysis answers the question , “Which economic scenario is most likely to come true now?”
- The candles are large and in succession
- The price is far from average.
- The momentum is strong and dominant.
- Long-term trend strength
- Weak entry points from current levels
3. Weighing the current technical probabilities
- Probability of continued direct upward movement from current levels: ≈ 35%
- Probability of correction, consolidation, or downward movement first: ≈ 65%
- Long-term economic price ≈ $40
- Impulse price ≈ $110
- Probability of a breakout (according to the current technical analysis) ≈ 35%
Approximate result: Based on the above, the fair price of silver is $64–65 per ounce.
2. Interpretation of the result
- Buying significantly above this range is a bet on continued momentum exceeding current probability.
- The expected return from higher levels becomes negative, not because the trend is downward, but because the risk-reward equation is unbalanced. This is the case when combining the probabilities of technical analysis with those of economic analysis. However, there is another school of valuation that does not rely entirely on technical analysis in its equation. Therefore, the fair value of silver in this case is somewhat different.
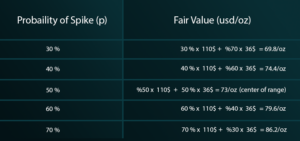
The fair value accepted today (taking into account fundamentals and cyclical fluctuations) would be: ≈ $75-85 per ounce. This range reflects the higher cost at $36 per ounce, a potential price rise near current market levels (around $110 per ounce), and the possibility of silver returning to its base levels rather than remaining at record highs.InterpretationIf you are optimistic about demand trends (industrial and monetary) and believe the rise will continue, focus more on peak demand (around 60% to 70%), resulting in a price between $80 and $86 per ounce. Conversely, if you are neutral or cautious, focus more on fundamental factors (around 30% to 40%), resulting in a price between $70 and $75 per ounce. This means that the lower you assume the probability of an upward move from current levels, the lower the price will be. The opposite is also true. You are free to choose the probability percentage that best suits your perspective, but for simplicity, refer to the following table, which presents the probability percentages for all possible market conditions and the price of silver at each probability level.