

Standard & Poor’s 500 Index.
4-hour chart of the S&P 500 (180625).
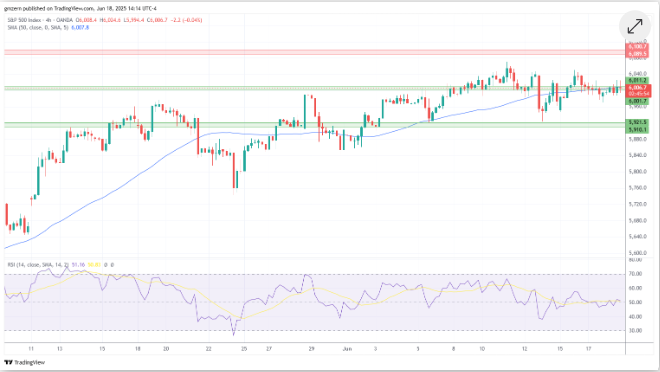
The S&P 500 index held near the 6,000 level, influenced by traders’ reaction to the Federal Reserve’s decision. The Fed left interest rates unchanged, in line with analysts’ expectations. The Fed also released its updated economic projections, which could have a significant impact on market dynamics. Notably, the federal funds rate forecast for 2026 was raised from 3.4% to 3.6%, while the 2027 forecast was raised from 3.1% to 3.4%. Investors are simply anticipating that the Fed will not rush to cut interest rates in the next few years, despite the central bank’s belief that it will be ready to push rates below 4.00% by the end of 2025. Today, traders also had the opportunity to review the initial jobless claims report. The report indicated that 245,000 Americans filed for unemployment benefits during the week, which was in line with analysts’ expectations. Both housing market reports fell short of analysts’ expectations. Housing starts fell -9.8% month-over-month in May, compared to analysts’ forecasts of -0.8%. Building permits fell -2%, compared to analysts’ expectations of -1.5%. Traders also monitored the situation in the Middle East. President Donald Trump recently declined to say whether the United States would join Israel in attacking Iran to destroy its nuclear program. News from the Middle East will continue to be an important catalyst for global markets.
The S&P 500 is currently attempting to stabilize below the support level between 6000 and 6010. If this attempt succeeds, the index will head toward the next support level between 5910 and 5920. Traders should note that Powell’s press conference could have a significant impact on the S&P 500’s dynamics.
Nasdaq technology index.
NASDAQ 180625 Chart (4 Hours)

The Nasdaq index moved back and forth after the Federal Reserve’s decision. The index failed to settle above its 50-day moving average at 21,794.
If the Nasdaq falls below 21,700, it will head towards the nearest support level, which is between 21,450 and 21,500.
Dow Jones Industrial Average.
Dow Jones Chart 180625 (4-hour)
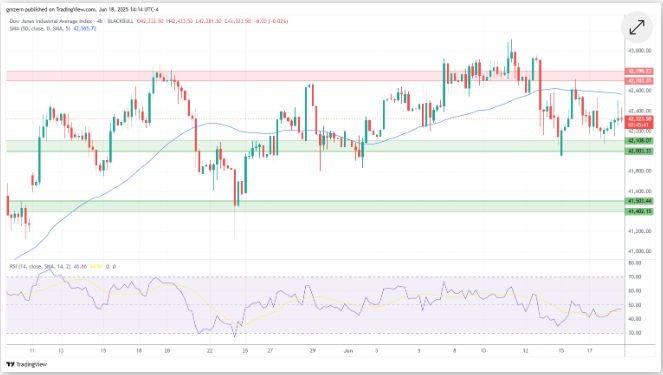
The Dow Jones index attempted to rally after the Fed’s decision, but lost momentum and retreated toward the 42,300 level. A break below the 42,000-42,100 support level would open the way for a test of the next support level, 41,400-41,500.