

Table of Contents
What Is Technical Analysis?
A Complete Guide for Every Trader
What is Technical Analysis? After understanding what fundamental analysis is and how traders use it to make informed decisions, we now move to one of the most debated and fascinating methods of market analysis.
Unlike fundamentals, which focus on the “why” behind market movements, this method dives deep into the “how” by examining price charts, patterns, and market behavior itself.

Let’s Dive in,
What Is Technical Analysis?
Technical analysis is a method of studying trading activity by observing changes in price and trading volume. This helps traders identify opportunities and make better trading decisions. In technical analysis, traders use charts and tools to spot patterns, trends, and key support and resistance levels. Unlike fundamental analysis, which evaluates a security’s value based on financial data, technical analysis focuses on price action and market behavior.
History of Technical Analysis
- Ancient Assyrian and Greek Markets
The earliest traces of technical analysis can be found in Assyrian trading stations and Greek markets, where merchants informally tracked price fluctuations and speculative activity. - 1688 – Joseph de la Vega (Amsterdam)
Joseph de la Vega, a diamond merchant, published Confusion of Confusions — the first book describing stock market behavior. He documented practices such as options trading, speculation, and the psychological aspects of markets. - Early 18th Century – Homma Munehisa (Japan)
In Japan, rice merchant Homma Munehisa developed early candlestick charting techniques to predict rice prices at the Dōjima Rice Exchange. His book The Fountain of Gold (1755) introduced candlestick patterns like the morning star and emphasized the role of emotions such as fear and greed. - Late 1800s – Charles Dow (USA)
Charles Dow, co-founder of Dow Jones & Co. and The Wall Street Journal, developed the Dow Theory. He believed that market trends could be confirmed when different indices (industrial and transportation) moved in the same direction. This is considered the beginning of modern technical analysis in the West. - 1920s–1930s – Expansion of Dow Theory
Analysts such as William Peter Hamilton, Robert Rhea, and Richard Schabacker expanded on Dow’s work. Hamilton wrote The Stock Market Barometer, while Schabacker’s Technical Market Analysis influenced generations of traders. - 1948 – Edwards and Magee
Robert Edwards and John Magee published Technical Analysis of Stock Trends, a foundational text that codified chart patterns such as head and shoulders, double tops and bottoms, and trendlines. This book remains a cornerstone in technical analysis education. - Mid–Late 20th Century – Rise of Indicators
The 20th century saw the creation of many popular technical indicators:- Joseph Granville introduced On-Balance Volume (OBV) in 1963.
- J. Welles Wilder Jr. developed the Relative Strength Index (RSI) in 1978.
- Gerald Appel created the Moving Average Convergence Divergence (MACD) indicator in the late 1970s.
- Late 20th – Early 21st Century – Modernization
With the rise of computers, charting software, and online trading platforms, technical analysis became more accessible and precise. Traders gained the ability to test strategies through backtesting, automation, and algorithmic trading. Today, technical analysis is integrated with other approaches such as quantitative analysis and behavioral finance.
The Godfathers of Technical Analysis
These pioneers, we can definitely call the Godfathers of Technical Analysis, laid the foundation for charting, trend analysis, and the creation of indicators that are still in use worldwide.
Homma Munehisa (1724–1803, Japan)

- Known as the father of candlestick charting.
- Developed early price-forecasting techniques in the 18th-century Japanese rice markets.
- Authored The Fountain of Gold (1755), introducing candlestick patterns like the morning star.
- First to highlight the importance of fear and greed in market psychology.
Charles Dow (1851–1902, USA)

- Co-founder of Dow Jones & Company and first editor of The Wall Street Journal.
- Creator of the Dow Theory, which remains the cornerstone of modern TA.
- Introduced the principle that markets move in trends—primary, secondary, and minor.
- His work is the true birthplace of Western technical analysis.
William Peter Hamilton (1867–1929, USA)
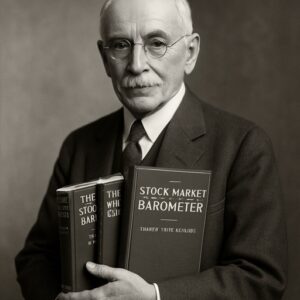
- Successor to Dow’s ideas and chief advocate of the Dow Theory.
- Author of The Stock Market Barometer (1922).
- Emphasized that multiple indices must confirm trends for them to be valid.
Robert Rhea (1879–1939, USA)

- Expanded and popularized Dow Theory after Hamilton’s passing.
- Made Dow’s insights practical and actionable for investors.
- Cemented TA’s role in market forecasting during the early 20th century.
Richard W. Schabacker (1882–1935, USA)

- Known as the father of modern technical analysis in the U.S..
- Authored Technical Market Analysis and Stock Market Theory and Practice.
- Introduced systematic approaches to trendlines, chart patterns, and price behavior.
Robert D. Edwards & John Magee (1948, USA)
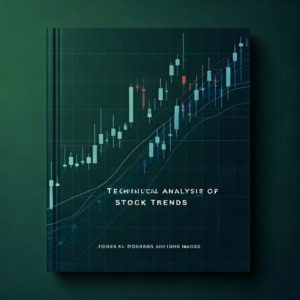
- Authors of Technical Analysis of Stock Trends, often called the Bible of charting.
- Codified classic patterns: head and shoulders, double tops, triangles, and trendlines.
- Their teachings remain core material for traders today.
Ralph Nelson Elliott (1871–1948, USA)
- Creator of the Elliott Wave Theory.
- Argued that markets move in repetitive cycles influenced by crowd psychology.
- His wave concepts are still applied in modern trading systems.
W.D. Gann (1878–1955, USA)
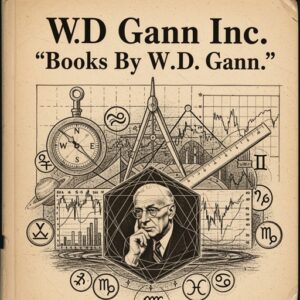
- Developed Gann angles, square of nine, and time cycles.
- Believed that geometry, mathematics, and even astrology could influence markets.
- Remains one of the most controversial yet followed figures in TA.
J. Welles Wilder Jr. (1935–2021, USA)

- Revolutionized TA with a suite of indicators in the 1970s:
- Relative Strength Index (RSI)
- Average True Range (ATR)
- Parabolic SAR
- Directional Movement Index (DMI)
- His work provided traders with momentum and volatility measures still relied upon today.
Gerald Appel (1933–2020, USA)

- Inventor of the MACD (Moving Average Convergence Divergence).
- One of the most widely used tools for identifying trend strength and momentum shifts.
Joseph Granville (1923–2013, USA)

- Creator of On-Balance Volume (OBV) in 1963, linking volume directly to price changes.
- Popularized the principle that volume precedes price movements.
Main Principles of Technical Analysis
Technical analysis is based on a few core assumptions that guide how traders interpret markets:
- Price Discounts Everything
- All available information, including news, economic data, and market sentiment, is already reflected in the current price.
- This principle means traders do not need to analyze fundamentals separately when using technical analysis.
- Prices Move in Trends
- Prices rarely move randomly; they tend to follow identifiable trends over time.
- Recognizing trends helps traders decide when to enter or exit a position.
- History Tends to Repeat Itself
- Market psychology is consistent across time, causing patterns to recur.
- Past price behavior, therefore, provides insight into potential future movements.
- Market Behavior Reflects Psychology
- Prices reflect the collective emotions and actions of market participants.
- Fear, greed, and herd behavior drive trends, support/resistance levels, and reversals.
The main types of Technical Analysis
Chart Patterns
- Focuses on identifying patterns and formations in price charts.
- Helps determine support and resistance levels.
- Examples of patterns:
- Triangles (ascending, descending)
- Head and Shoulders
- Double Tops/Bottoms
- Patterns are interpreted to predict breakouts, breakdowns, or reversals.
Technical Indicators
- Uses mathematical formulas applied to price and volume data.
- Common indicators include:
- Moving Averages – smooth price data to identify trends.
- MACD (Moving Average Convergence Divergence) – compares multiple moving averages for trend and momentum signals.
- RSI (Relative Strength Index) – identifies overbought or oversold conditions.
- Indicators help confirm trends, reversals, and trading signals quantitatively.
Indicators and Tools in Technical Analysis
- Price trends
- Chart patterns
- Volume and momentum indicators
- Oscillators
- Moving averages
- Support and resistance levels
Pros and Cons of Technical Analysis
Pros
- Identifies market trends (bullish, bearish, or sideways).
- Provides clear entry and exit signals for trades.
- Helps manage risk and minimize potential losses.
- Offers a structured, data-driven decision-making approach.
Cons
- Can be subjective, with different analysts interpreting signals differently.
- Ignores fundamental factors such as earnings or economic data.
- May give false signals or fail in certain market conditions.
- Requires significant skill and experience, making it challenging for beginners.
- Efficient Market Hypothesis (EMH): Some argue that past data has no predictive power.
- History doesn’t repeat exactly — price movements may follow a random walk.
- Can act as a self-fulfilling prophecy (e.g., if many traders react to the 200-day moving average, it may trigger the move but not sustain it long-term).
Technical Analysis Vs Fundamental Analysis
|
Aspect |
Technical Analysis (TA) | Fundamental Analysis (FA) |
|
Definition |
Studies past price movements and trading volume to forecast future prices. |
Studies economic, financial, and qualitative factors to assess intrinsic value. |
|
Core Principle |
“Price discounts everything” – all news and fundamentals are reflected in market prices. | Asset prices can deviate from true value; analysis seeks to find under/overvalued assets. |
| Data Used |
Historical charts, candlestick patterns, indicators (RSI, MACD, Bollinger Bands), volume data. |
Economic reports, company earnings, GDP, inflation, interest rates, management performance, industry trends. |
|
Time Horizon |
Short-term (seconds, minutes, days, weeks). |
Long-term (months, years). |
|
Tools & Methods |
Charting tools, trend lines, support/resistance, oscillators, moving averages. |
Financial statements, economic models, central bank policies, balance sheets, P/E ratios, earnings reports. |
|
Focus |
Identifying patterns, trends, and signals for entry/exit. |
Determining the intrinsic value of an asset relative to its market price. |
|
Market Applicability |
Widely used in Forex, stocks, commodities, and crypto for short-term strategies. |
More applicable to stocks, bonds, and macro-driven currencies for long-term strategies. |
|
Trading Style |
Scalping, day trading, swing trading. |
Position trading, value investing, long-term portfolio building. |
|
Strengths |
Provides actionable entry/exit points. – Useful in highly liquid and volatile markets (Forex, crypto). – Can be automated with trading systems. |
Offers deep insight into true asset value. – Helps in building long-term investment strategies. – Better for understanding macroeconomic and company fundamentals. |
|
Weaknesses |
– May generate false signals. – Less effective in low-volume or manipulated markets. – Ignores broader economic context. |
– Slow to react to sudden price changes. – Relies on assumptions and forecasts that may be wrong. – Requires extensive data and research. |
|
Assumptions |
History repeats itself, trends persist, and market psychology drives price action. |
Markets are not always efficient, and intrinsic value can differ from market price. |
|
Best Suited For |
Traders looking for short-term profits and frequent trades. |
Investors looking for long-term value and sustainable growth. |
| Example in Action | A trader uses RSI and moving averages to time a forex entry on EUR/USD. |
An investor studies oil supply/demand and central bank policies to predict CAD performance. |
Wrap-Up
We have now explored both technical analysis and fundamental analysis, and highlighted the key differences that set them apart.
As a trader, it’s important to learn and experiment with both methods to discover which approach best suits your personal trading style. While some traders prefer the structured, data-driven approach of technical analysis, others rely on the deeper insights offered by fundamental analysis.
The best practice, however, is not to treat them as opposing tools but to blend both methods when making trading decisions. By combining the strengths of technical and fundamental analysis, and by always applying risk management strategies, you can minimize risks and increase your chances of long-term success in the markets.